CR2606: Multi-state models for time-to-event data
SISCER 2026 Module 6 Multi-state models for time-to-event data, with applications to clinical research
Module info
- Location Online
- Meeting Times Mon, Jul 13, 8:30am-12pm PDT Tue, Jul 14, 8:30am-12pm PDT Wed, Jul 15, 8:30am-12pm PDT
-
-
Instructors
Terry Therneau

Registration is closed for this module.
Multi-state hazard models (MSH) have been a key part of the R survival package, and play a significant role in our group’s medical research work. This has been a case where the medical research questions drove the methods, and the methods in turn drove the software. As an example, here is the state space diagram for a study in aging.
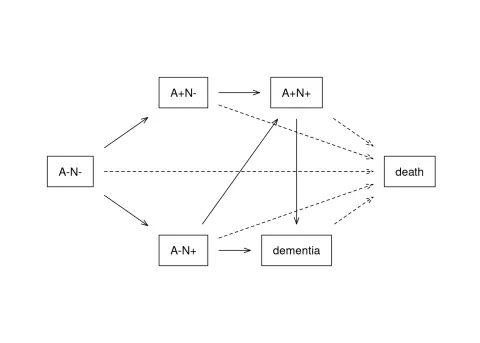
We are interested in the accumulation brain amyoid (A+) and neural loss (N+) over time, in this case assessed by PET and MRI imaging methods; but in particular how various factors affect progression along these pathways. Outcomes of the fit include ps(t;x), the probability of being in state s at time t given covariates x, the number of visits to each state E[Ns(t;x)], e.g., the probability of dementia before death, and the expected number of years in each state.
We have found multi-state models to be an increasing portion of our analysis, as opposed to the simple survival models from which they arose: the medical research questions of interest have simply become broader than simple alive vs dead. (The example above is a particularly complex one, BTW, most will be simpler). When biomarkers of the states are imperfect, a particular issue with brain research, which lacks antemortem biopsy, MSH models become partially hidden Markov models (HMM) and we will touch on this as well. The goal of the course is to give users practical insight into the application of these tools in their own work. Mathematics and code will appear as needed, but neither is a focus. Rmd files for all the examples and figures will be provided for those who want to dig more deeply into the programming details.